

Surveyors: Always in the ‘middle’ of something…
March 2, 2022 – By Tim Burch

The surveying profession is intrinsically involved with many functions of today’s communities and environment. When we take a closer look at the roles we play, the surveyor is usually found in the middle. Here are a few examples.
- For new developments and infrastructure, surveying takes place after a client decides to begin a project. Site data must be collected, drafted and presented to the client, engineers and architects for design.
- Upon completion of the engineering design, the surveyor provides layout services for the construction company to build the structure.
- Once the improvements are completed, the surveyor provides surveys as well as record drawings for confirmation of construction to satisfy government agencies and financial backers.
- In a property dispute, the surveyor becomes the center of attention — our professional opinion determines the correct location of the subject boundary.
This responsibility also extends to the geospatial sectors within the surveying profession. Data collection is a critical step to creating and maintaining efficient geographic information system (GIS) databases that correctly depict existing infrastructure and parcel boundary layers. With the surveyor at the center of many of these duties and tasks, no wonder that we sometimes feel we have a bullseye on our backs.
Knowing how to compute the center is an important aspect of the surveyor’s duty.
However, the word center takes on a different connotation when it comes to data and objects. Properly identifying the center of specific sets of data or objects is important when working with construction information and geospatial data. Properly measuring and marking the center of an installation has its challenges, so knowing how to compute the center is an important aspect of the surveyor’s duty.
Why is the center of an object important?
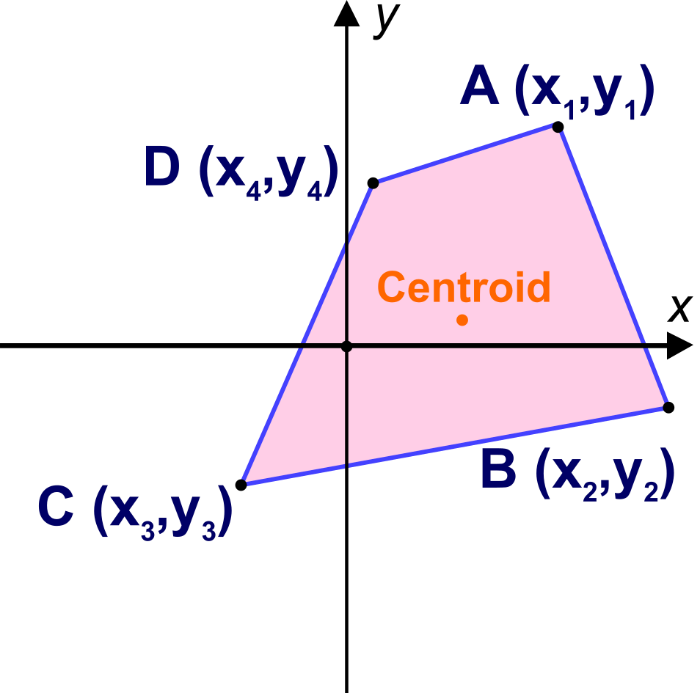
Every object that is definable in a two-dimensional space has a physical center. Whether the object is a regular or irregular polygon in plane geometry, there are various methods for determining its center.

These figures are easy to understand and simple to solve. More complex figures require more calculations, including coordinate geometry.

These examples of regular and irregular polygons have something in common: all are based upon two-dimensional space, which is flat. But what happens if we need to determine the center of a shape that does not fall on a 2D surface? What if the data being reviewed for a center resides on a spherical surface and contains diverging axes?
As surveyors, we break our work down to smaller coordinate systems to work around the fact that our data resides on a spherical surface, but some datasets require the information to remain as latitude and longitude. One dataset is population counts, otherwise known as the census.
The U.S. Census and the ‘center of population’
The U.S. Census Bureau has been at work since early colonial times. This excerpt from the bureau website explains its purpose and foundation.
The U.S. Constitution requires only that the decennial census be a population count. Since the first census in 1790, however, the need for useful information about the United States’ population and economy became increasingly evident.
The decennial census steadily expanded throughout the nineteenth century. By the turn of the century, the demographic, agricultural, and economic segments of the decennial census collected information on hundreds of topics. The work of processing these data kept the temporary Census Office open for almost all the decades following the 1880 and 1890 censuses.
Recognizing the growing complexity of the decennial census, Congress enacted legislation creating a permanent Census Office within the Department of the Interior on March 6, 1902. On July 1, 1902, the U.S. Census Bureau officially “opened its doors” under the leadership of William Rush Merriam.
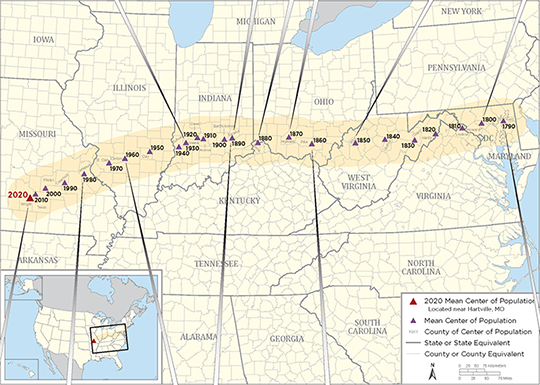
Counting the citizens of the United States was one thing, but mapping them was another. Once the final count was completed and mapped, the information was used to determine a unique location: the center of population. Here is more from the Census Bureau on the calculation basis:
The concept of the center of population as used by the U.S. Census Bureau is that of a balance point. The center of population is the point at which an imaginary, weightless, rigid, and flat (no elevation effects) surface representation of the 50 states (or 48 conterminous states for calculations made prior to 1960) and the District of Columbia would balance if weights of identical size were placed on it so that each weight represented the location of one person.
More specifically, this calculation is called the mean center of population.
This sounds like an easy exercise for a room of mathematicians and mappers, right? On the contrary, my fellow geospatialists!
How do they determine the center of population?
Computing the center of population for the United States would be much easier if we existed on a two-dimensional plane, as previously discussed. Since we don’t, however, it requires a much more difficult method of calculation to get us closer to a real-world solution:
To avoid unduly complex factors in the computations, the mathematical formulae used were those that would be precise for a true sphere. On such a sphere, the north-south distances between parallels of latitude are identical and distances in degrees may be used as units of distance. On the other hand, distances between meridians on longitude lines are not constant but decrease from the equator toward the poles. However, if the length of one degree along the equator is used as the unit of measurement, then the length in degrees of an east-west line at any other latitude can be adjusted to the measurement standard by multiplying by the cosine of the latitude.
The center of population computed by the Census Bureau is the point whose latitude (𝜙) and longitude (λ) satisfy the equations:
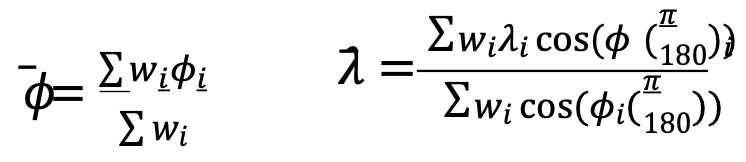
where 𝜙𝑖, 𝜆𝑖 and 𝑤𝑖 are the latitude, longitude and population attached to the basic small units of area used in the computation.
Stated in less mathematical form, the latitude of the center of population was determined by multiplying the population of each unit of area by the latitude of its population center, then adding all these products and dividing this total by the total population of the United States. The result is the latitude of the population center.
East-west distances were measured, or computed, in substantially the same manner, but with the inclusion of a correction for latitude. For these distances, a degree of longitude at the equator was the unit of measurement. East-west distances along the equator could be measured in degrees, but any east-west degree distance north of the equator — where all the United States is located — had to be adjusted to recognize the convergence of meridians toward the poles. This adjustment required that each east-west distance, stated in degrees of longitude, be multiplied by the cosine of the latitude. This mathematical relationship is precise for a sphere and a very close approximation for the earth.
The computation required that the longitude of each of the thousands of selected points be multiplied by the cosine of the latitude of the point and by the population associated with the point. These products were added and divided by the sum of the products for the same thousands of points, each of which was obtained by multiplying the cosine of the latitude of a point by the appropriate population figure. The result was the longitude of the center of population.
(Courtesy of the Geography Division, U.S. Census Bureau, published November 2021)